
Using the LTC interactive map
National Highways have released the latest version of their LTC interactive map as part of the Local Refinement Consultation. We’ve managed to discover all sorts of info from previous versions of the interactive map, but it’s not necessarily the easiest of maps to figure out, so in this update we try to help give you a better understanding of how to use it.
Firstly, where can you find the map? The latest version of the interactive map can be found HERE.
When you first click through to the interactive map you’ll see that NH have provided some very basic suggestions on using the map, but we’ve been hearing from quite a few people who are still unsure of how to use the map to actually discover some of the info you’re trying to find.
When you first load the map you’ll just see the red line of the route. This is what we’ve been referring to for a while now as the development boundary, but NH are now referring to as the Order Limits. This is more technical terminology that NH will use in the Development Consent Order, and it seems to us that in this consultation they are trying to get away with using lots of more technical terminology, likely copied and pasted from their first attempt at the DCO. This is despite the fact they’re meant to provide consultation information in a clear and informative way.
Anyway, back to the map.
In the top left you have the + and – to zoom in and out. The house icon takes you back to an overview of the whole proposed route. And the circle at the bottom will take you to your location, if you have ‘Location’ active on your device. There is also of course a search bar where you can type in address or place.
You will see a selection of icons in the top right of the map. Zoom in on an area you wish to view first.
The first icon (4 squares) when hovered over will have a tag of ‘Change Basemap’
When clicked this option gives you a variety of different base maps to view the layers upon. Select the style of map you wish to use. You can go back and change this at any time.
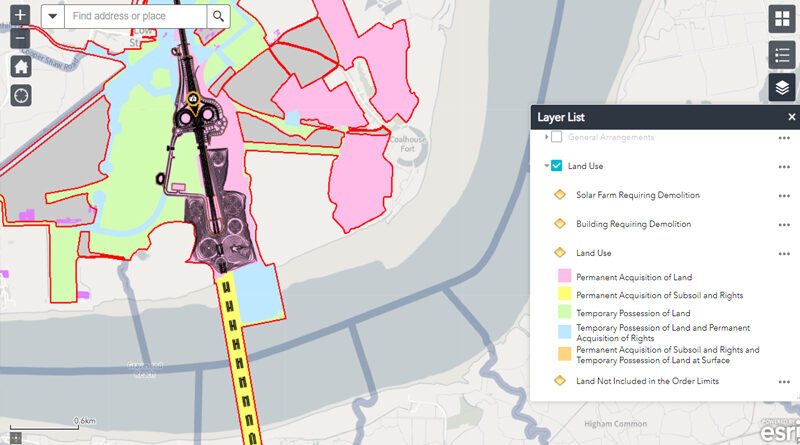
The second icon (3 shapes with lines next to them) when hovered over will have a tag of ‘Legend’
When clicked this option shows you the key for the map, ie the icons, colours, shading etc used for various aspects of the proposed plans. It is worth noting that the information in this section changes as you select and de-select different layers, so keep popping back in to check what the various details mean.
The third icon (3 stacked diamond shapes) when hovered over will have a tag of ‘Layers’
When clicked this option gives you even more options to select and de-select to show all the different layers of detail on the map. You can click the little arrow to the left side of each selection box to expand and view a sub menu which provides even more detail. Alternatively, you can also click the line of each description which will expand and reveal the further info. On the actual map you can also click it and little info boxes appear with more detail/photos etc. If is definitely worth clicking around in here, and also worth noting that some of the info may not be in the category you would expect it to be in, so take a good look around!
The fourth icon (a ruler) when hovered over will have a tag of ‘Measurement’
Within this option there are more icons.
The first – ‘Area’ – select this along with the type of measurement you wish to calculate (eg acres, feet etc) then click on the map to mark out the shape of the area you wish to measure. So for instance if you wish to measure a square shaped area on the map click in the first corner, then the second corner, then the third and finally double click on the fourth corner to complete the square. The shape will be shaded and the measurement will appear. You can change between acres, feet, etc if you wish to see the measurement in a different type. To clear the area/measurement simply click ‘Clear’.
The second – ‘Distance’ – select this along with the type of measurement you wish to calculate (eg miles, kms, feet, etc) then click on the map at the starting point of where you wish to calculate the distance, and then double click at the end point of where you wish to calculate to. This will then display the distance. Again you can switch between miles, kms, feet etc if you wish. Again click ‘Clear’ to clear the calculation.
The third – ‘Location’ – select this along with the type of measurement you wish to view (eg Degrees or DMS) then click on the map, and you’ll get the longitude and latitude. Again click ‘Clear’ to remove the calculation.
The fifth icon (a printer) when hovered over will have a tag of ‘Print’
Use the various options to select what you want and then print either to a printer, or PDF to save to your device.
We hope this is helpful, and good luck searching through all the detail on the map!
Don’t forget to comment on the interactive map in your consultation response too. Let them know if you found it hard to use, there were any issues etc. Have your say. Together we are stronger!
Related
The latest LTC maps – click here