
LTC – Greenbelt destruction
The proposed Lower Thames Crossing (LTC) would mean so much greenbelt destruction. We talk about this all the time, but we thought it would be interesting to view it on a map.
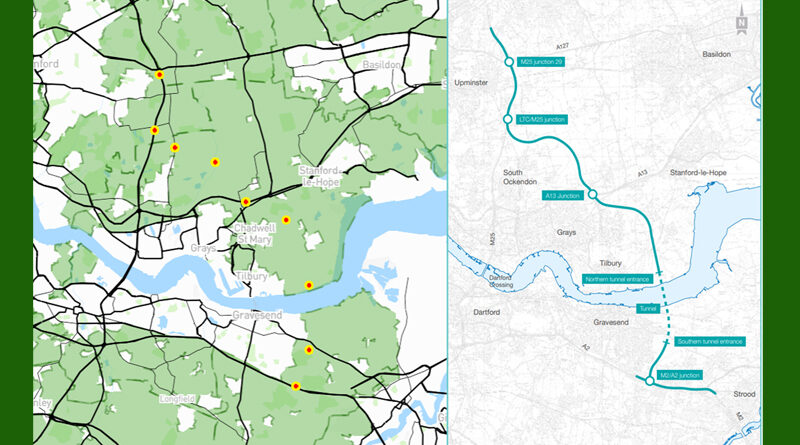
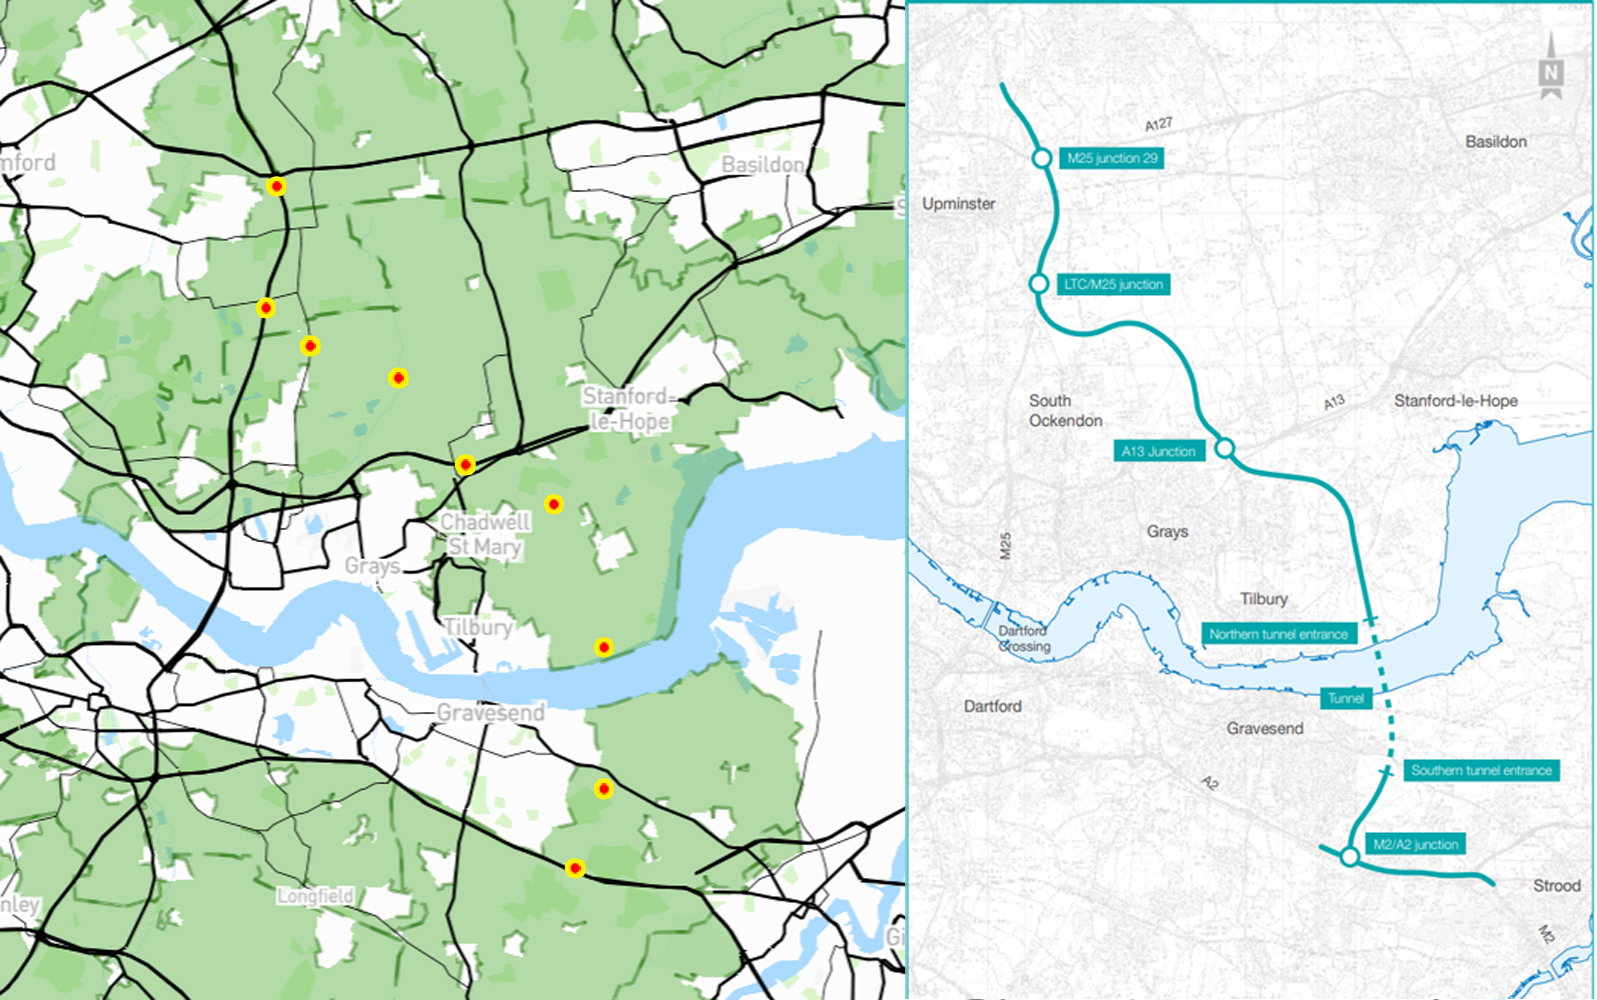
We have used a Greenbelt Land map taken from Urbanist Architecture‘s website, which uses the latest available Government data. You can click through and view it, it’s interactive so you can zoom in and out etc.
We have done our best to roughly plot the LTC route with red dots on the greenbelt map, and placed a copy of the latest LTC route map along side it. Remember this is just the route, and doesn’t take into account the whole development boundary and all the land that would be needed for construction etc.
If you wish to compare the development boundary take a look at the LTC interactive map. It may be helpful to check the Land Use layer in addition to the default settings, so you can see whether land is proposed to be taken permanently or not, to reveal the true extent of impact and destruction of greenbelt land by the LTC, if it goes ahead.
National Highways have to date refused to tell us how much greenbelt land would be lost/impacted. We know Thurrock Council has estimated around 11% of the greenbelt in Thurrock alone would be consumed if LTC goes ahead.
There is also a London Greenbelt Council map that shows threats to the greenbelt, on which LTC has been reported as a threat.